# Profiling on Windows
## Introducing WPR and WPA
High-level performance analysis (including memory usage) can be performed with the Windows
Performance Recorder (WPR) and Windows Performance Analyzer (WPA). As the names suggest, WPR is for
recording system statistics (in the form of event trace log a.k.a. ETL files), while WPA is for
analyzing these ETL files.
WPR collects system wide statistics, so it won't just record things relevant to rustc but also
everything else that's running on the machine. During analysis, we can filter to just the things we
find interesting.
These tools are quite powerful but also require a bit of learning
before we can successfully profile the Rust compiler.
Here we will explore how to use WPR and WPA for analyzing the Rust compiler as well as provide
links to useful "profiles" (i.e., settings files that tweak the defaults for WPR and WPA) that are
specifically designed to make analyzing rustc easier.
### Installing WPR and WPA
You can install WPR and WPA as part of the Windows Performance Toolkit which itself is an option as
part of downloading the Windows Assessment and Deployment Kit (ADK). You can download the ADK
installer [here](https://go.microsoft.com/fwlink/?linkid=2086042). Make sure to select the Windows
Performance Toolkit (you don't need to select anything else).
## Recording
In order to perform system analysis, you'll first need to record your system with WPR. Open WPR and
at the bottom of the window select the "profiles" of the things you want to record. For looking
into memory usage of the rustc bootstrap process, we'll want to select the following items:
* CPU usage
* VirtualAlloc usage
You might be tempted to record "Heap usage" as well, but this records every single heap allocation
and can be very, very expensive. For high-level analysis, it might be best to leave that turned
off.
Now we need to get our setup ready to record. For memory usage analysis, it is best to record the
stage 2 compiler build with a stage 1 compiler build with debug symbols. Having symbols in the
compiler we're using to build rustc will aid our analysis greatly by allowing WPA to resolve Rust
symbols correctly. Unfortunately, the stage 0 compiler does not have symbols turned on which is why
we'll need to build a stage 1 compiler and then a stage 2 compiler ourselves.
To do this, make sure you have set `debuginfo-level = 1` in your `bootstrap.toml` file. This tells
rustc to generate debug information which includes stack frames when bootstrapping.
Now you can build the stage 1 compiler: `x build --stage 1 -i library` or however
else you want to build the stage 1 compiler.
Now that the stage 1 compiler is built, we can record the stage 2 build. Go back to WPR, click the
"start" button and build the stage 2 compiler (e.g., `x build --stage=2 -i library`).
When this process finishes, stop the recording.
Click the Save button and once that process is complete, click the "Open in WPA" button which
appears.
> Note: The trace file is fairly large so it can take WPA some time to finish opening the file.
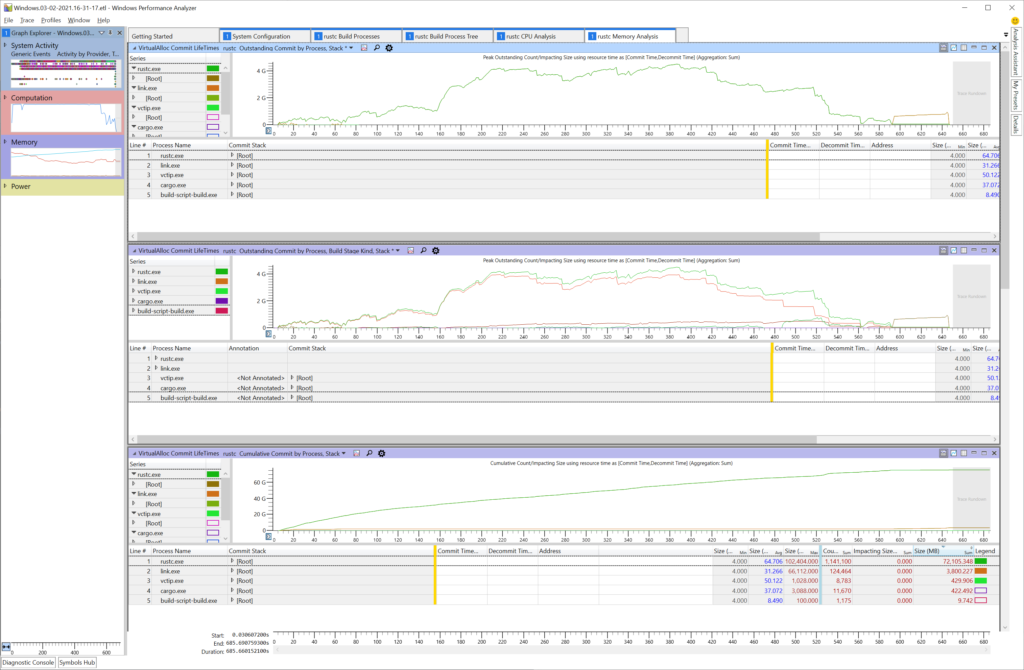
## Analysis
Now that our ETL file is open in WPA, we can analyze the results. First, we'll want to apply the
pre-made "profile" which will put WPA into a state conducive to analyzing rustc bootstrap. Download
the profile [here](https://github.com/wesleywiser/rustc-bootstrap-wpa-analysis/releases/download/1/rustc.generic.wpaProfile).
Select the "Profiles" menu at the top, then "apply" and then choose the downloaded profile.
You should see something resembling the following: