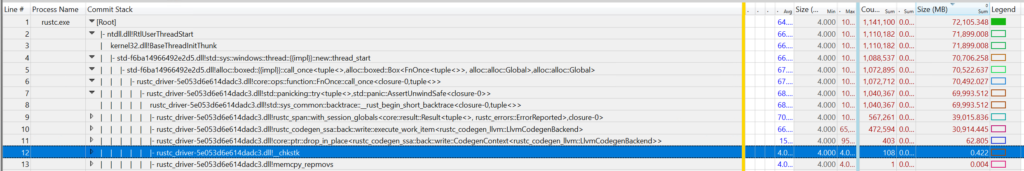
In this sample, you can see calls through codegen are allocating ~30gb of memory in total
throughout this profile.

## Other Analysis Tabs

The profile also includes a few other tabs which can be helpful:

- System Configuration
    - General information about the system the capture was recorded on.
- rustc Build Processes
    - A flat list of relevant processes such as rustc.exe, cargo.exe, link.exe etc.
    - Each process lists its command line arguments.
    - Useful for figuring out what a specific rustc process was working on.
- rustc Build Process Tree
    - Timeline showing when processes started and exited.
- rustc CPU Analysis
    - Contains charts preconfigured to show hotspots in rustc.
    - These charts are designed to support analyzing where rustc is spending its time.
- rustc Memory Analysis
    - Contains charts preconfigured to show where rustc is allocating memory.