.iterate_to_fixpoint(tcx, body, None);
.into_results_cursor(body);
// Inspect the fixpoint state immediately before each `Drop` terminator.
for (bb, block) in body.basic_blocks().iter_enumerated() {
if let TerminatorKind::Drop { .. } = block.terminator().kind {
results.seek_before_primary_effect(body.terminator_loc(bb));
let state = results.get();
println!("state before drop: {:#?}", state);
}
}
```
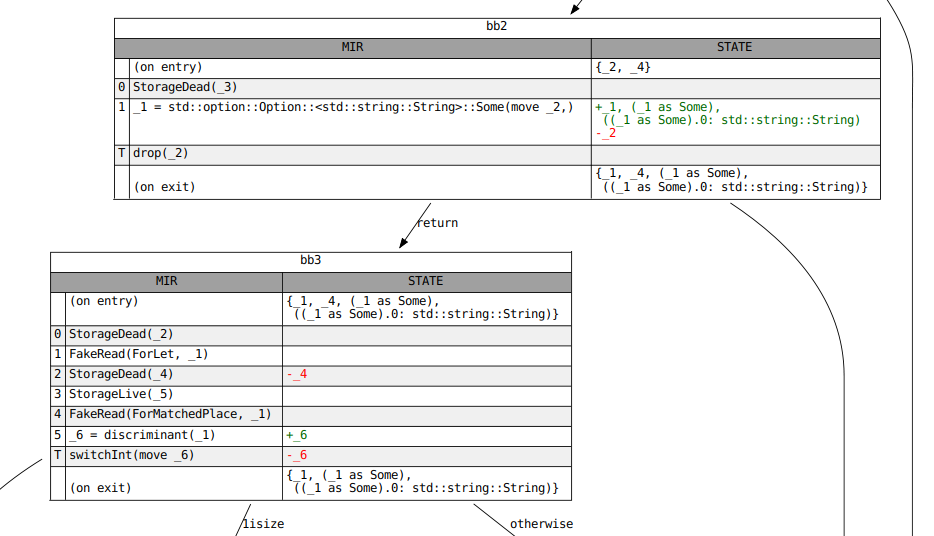
### Graphviz Diagrams
When the results of a dataflow analysis are not what you expect, it often helps
to visualize them. This can be done with the `-Z dump-mir` flags described in
[Debugging MIR]. Start with `-Z dump-mir=F -Z dump-mir-dataflow`, where `F` is
either "all" or the name of the MIR body you are interested in.
These `.dot` files will be saved in your `mir_dump` directory and will have the
[`NAME`] of the analysis (e.g. `maybe_inits`) as part of their filename. Each
visualization will display the full dataflow state at entry and exit of each
block, as well as any changes that occur in each statement and terminator. See
the example below: