Next, we will need to tell WPA to load and process debug symbols so that it can properly demangle
the Rust stack traces. To do this, click "Trace" and then choose "Load Symbols". This step can take
a while.
Once WPA has loaded symbols for rustc, we can expand the rustc.exe node and begin drilling down
into the stack with the largest allocations.
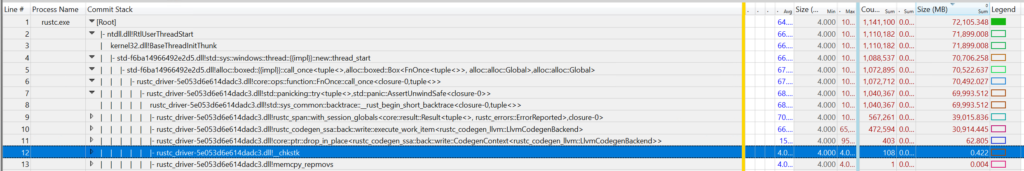
To do that, we'll expand the `[Root]` node in the "Commit Stack" column and continue expanding
until we find interesting stack frames.
> Tip: After selecting the node you want to expand, press the right arrow key. This will expand the
node and put the selection on the next largest node in the expanded set. You can continue pressing
the right arrow key until you reach an interesting frame.