](https://4.bp.blogspot.com/-QAsedrM2UxI/Vkz8Aas-26I/AAAAAAAAAtM/9B7Z33vUQrg/s1600/sisdig%2B3.png)
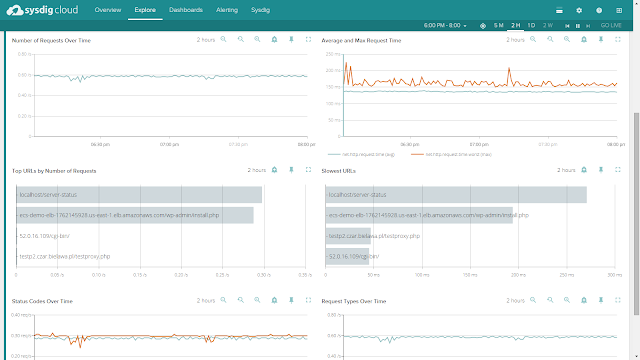
Keep in mind that the pods implementing this service are scattered across multiple machines, but we can still total request counts, response times and URL statistics aggregated together for this service. And don’t forget: this doesn’t require any configuration or instrumentation of wordpress, apache, or the underlying containers!
And from this view, I can now easily create alerts for these service-level metrics, and I can dig down into any individual container for deep inspection - down to the process level – whenever I want, including back in time!
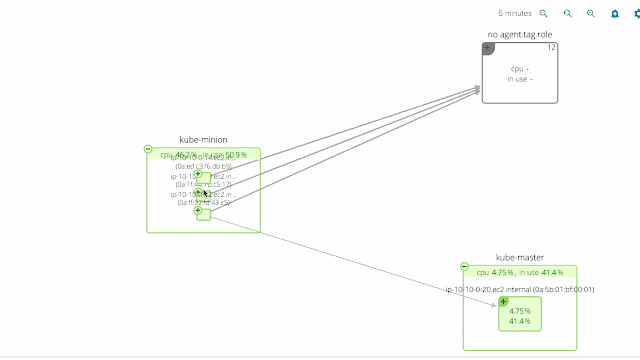
### Visualizing Your Kubernetes Services
We’ve also included Kubernetes awareness in Sysdig Cloud’s famous topology view, at both the physical and logical level.
[