](https://1.bp.blogspot.com/-lQ-P2gLywlY/Vkz9MOoTgGI/AAAAAAAAAtk/UB6pW7sUbQA/s1600/image09.gif)
### Actions!
One more thing about csysdig. As [recently announced](https://sysdig.com/csysdigs-hotkeys-turning-csysdig-into-a-control-panel-for-processes-connections-and-containers/), csysdig also offers “control panel” functionality, making it possible to use hotkeys to execute command lines based on the element currently selected. So we made sure to enrich the Kubernetes views with a bunch of useful hotkeys. For example, you can delete a namespace or a service by pressing "x," or you can describe them by pressing "d."
My favorite hotkeys, however, are "f," to follow the logs that a pod is generating, and "b," which leverages `kubectl` exec to give you a shell inside a pod. Being brought into a bash prompt for the pod you’re observing is really useful and, frankly, a bit magic. :-)
So that’s a quick preview of Kubernetes in sysdig. Note though, that all of this functionality is only for a single machine. What happens if you want to monitor a distributed Kubernetes cluster? Enter Sysdig Cloud.
### Monitoring Kubernetes with Sysdig Cloud
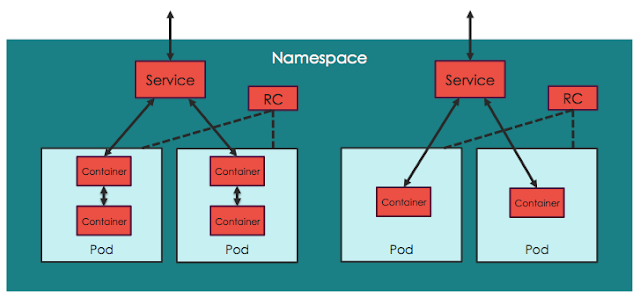
Let’s start with a quick review of Kubernetes’ architecture. From the physical/infrastructure point of view, a Kubernetes cluster is made up of a set of **minion** machines overseen by a **master** machine. The master’s tasks include orchestrating containers across minions, keeping track of state and exposing cluster control through a REST API and a UI.
On the other hand, from the logical/application point of view, Kubernetes clusters are arranged in the hierarchical fashion shown in this picture:
[