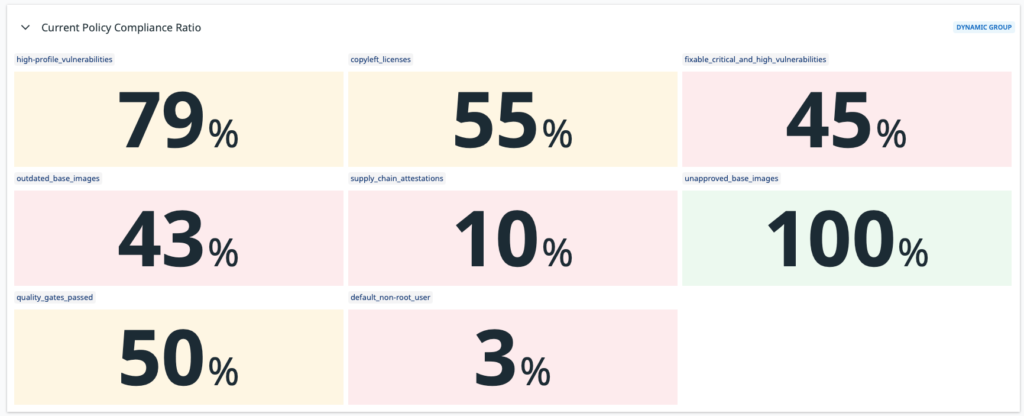
> The reason why the lines in the graphs look flat is due to the own nature of
> vulnerabilities (they don't change too often) and the short time interval
> selected in the date picker.

## Scrape interval

By default, Prometheus and Datadog scrape metrics at a 15 second interval.
Because of the own nature of vulnerability data, the metrics exposed through this API are unlikely to change at a high frequency.
For this reason, the metrics endpoint has a 60-minute cache by default,
which means a scraping interval of 60 minutes or higher is recommended.
If you set the scrape interval to less than 60 minutes, you will see the same data in the metrics for multiple scrapes during that time window.

To change the scrape interval:

- Prometheus: set the `scrape_interval` field in the Prometheus configuration
  file at the global or job level.
- Datadog: set the `min_collection_interval` property in the Datadog agent
  configuration file, see [Datadog documentation](https://docs.datadoghq.com/developers/custom_checks/write_agent_check/#updating-the-collection-interval).

## Revoke an access token

If you suspect that your PAT has been compromised or is no longer needed, you can revoke it at any time.
To revoke a PAT, follow the steps in the [Create and manage access tokens](/security/for-developers/access-tokens/#modify-existing-tokens).

Revoking a PAT immediately invalidates the token, and prevents Prometheus from scraping metrics using that token.
You will need to create a new PAT and update the Prometheus configuration to use the new token.