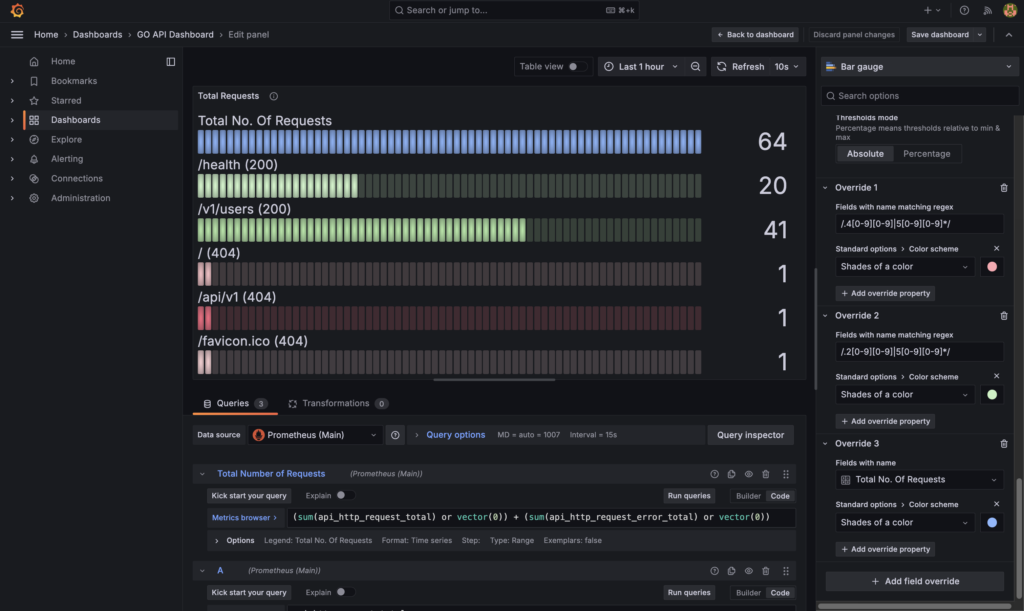
You created this panel to visualize the total number of requests from different endpoints to compare the successful and failed requests. For all the good requests, the bar will be green, and for all the failed requests, the bar will be red. Plus it will also show the from which endpoint the request is coming, either it's a successful request or a failed request. If you want to use this panel, you can import the `dashboard.json` file from the repository you cloned.

## Summary

You've come to the end of this guide. You learned how to develop the Golang application with Docker. You also saw how to use Docker Compose Watch to rebuild the image whenever you make changes to the code. Lastly, you tested the application and visualized the metrics in Grafana using Prometheus as the data source.