  - job_name: prometheus

    # metrics_path defaults to '/metrics'
    # scheme defaults to 'http'.

    static_configs:
      - targets: ["localhost:9090"]

  - job_name: docker
      # metrics_path defaults to '/metrics'
      # scheme defaults to 'http'.

    static_configs:
      - targets: ["host.docker.internal:9323"]
```

### Run Prometheus in a container

Next, start a Prometheus container using this configuration.

```console
$ docker run --name my-prometheus \
    --mount type=bind,source=/tmp/prometheus.yml,destination=/etc/prometheus/prometheus.yml \
    -p 9090:9090 \
    --add-host host.docker.internal=host-gateway \
    prom/prometheus
```

If you're using Docker Desktop, the `--add-host` flag is optional. This flag
makes sure that the host's internal IP gets exposed to the Prometheus
container. Docker Desktop does this by default. The host IP is exposed as the
`host.docker.internal` hostname. This matches the configuration defined in
`prometheus.yml` in the previous step.

### Open the Prometheus Dashboard

Verify that the Docker target is listed at `http://localhost:9090/targets/`.
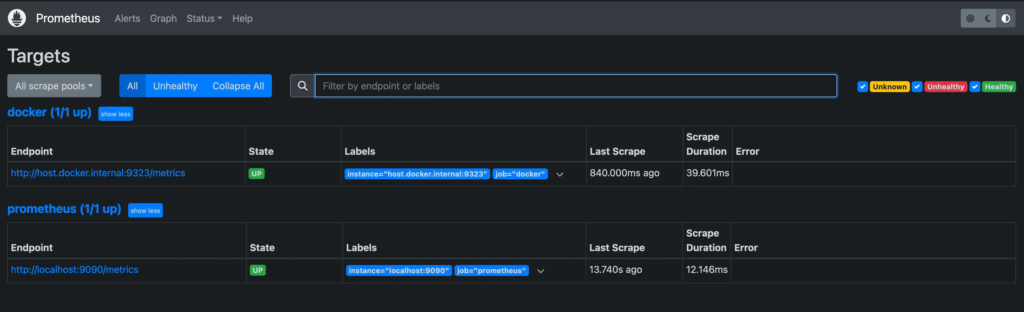
> [!NOTE]
>
> You can't access the endpoint URLs on this page directly if you use Docker
> Desktop.
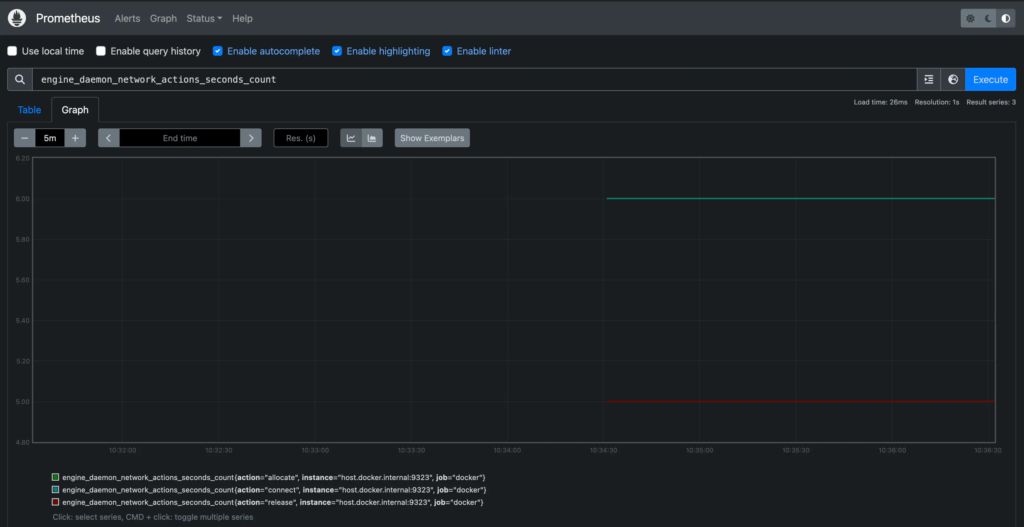
### Use Prometheus
Create a graph. Select the **Graphs** link in the Prometheus UI. Choose a metric
from the combo box to the right of the **Execute** button, and click
**Execute**. The screenshot below shows the graph for
`engine_daemon_network_actions_seconds_count`.