openmetrics (4.2.0)
-------------------
Instance ID: openmetrics:scout-prometheus-exporter:6393910f4d92f7c2 [OK]
Configuration Source: file:/etc/datadog-agent/conf.d/openmetrics.d/conf.yaml
Total Runs: 1
Metric Samples: Last Run: 236, Total: 236
Events: Last Run: 0, Total: 0
Service Checks: Last Run: 1, Total: 1
Average Execution Time : 2.537s
Last Execution Date : 2024-05-08 10:41:07 UTC (1715164867000)
Last Successful Execution Date : 2024-05-08 10:41:07 UTC (1715164867000)
```
For a comprehensive list of options, take a look at this [example config file](https://github.com/DataDog/integrations-core/blob/master/openmetrics/datadog_checks/openmetrics/data/conf.yaml.example) for the generic OpenMetrics check.
### Visualizing your data
Once the agent is configured to grab Prometheus metrics, you can use them to build comprehensive Datadog graphs, dashboards, and alerts.
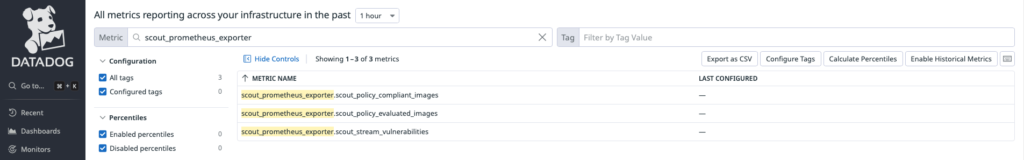
Go into your [Metric summary page](https://app.datadoghq.com/metric/summary?filter=scout_prometheus_exporter)
to see the metrics collected from this example. This configuration will collect
all exposed metrics starting with `scout_` under the namespace
`scout_metrics_exporter`.
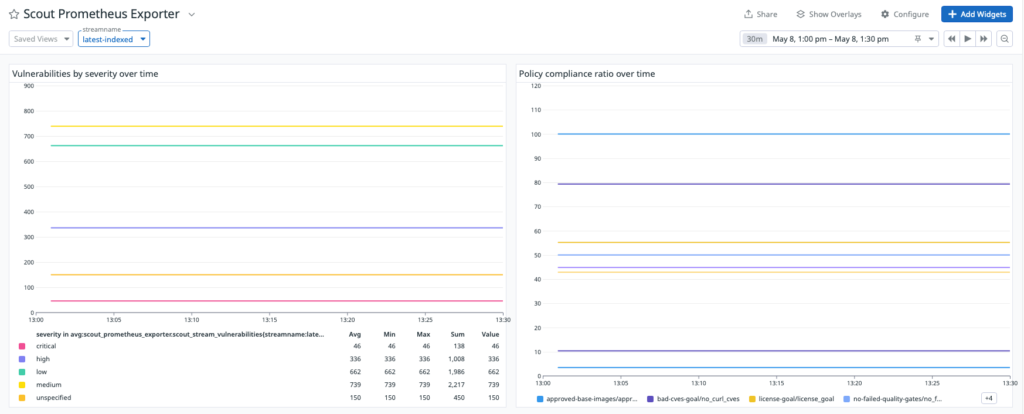
The following screenshots show examples of a Datadog dashboard containing
graphs about vulnerability and policy compliance for a specific [stream](#stream).