=> => exporting manifest list sha256:89ebc86fd51e27c1da440dc20858ff55fe42211a1930c2d51bbdce09f430c7f1 0.0s
=> => naming to docker.io/library/go-api:latest 0.0s
=> => unpacking to docker.io/library/go-api:latest 0.0s
=> [api] resolving provenance for metadata file 0.0s
service(s) ["api"] successfully built
```
## Testing the application
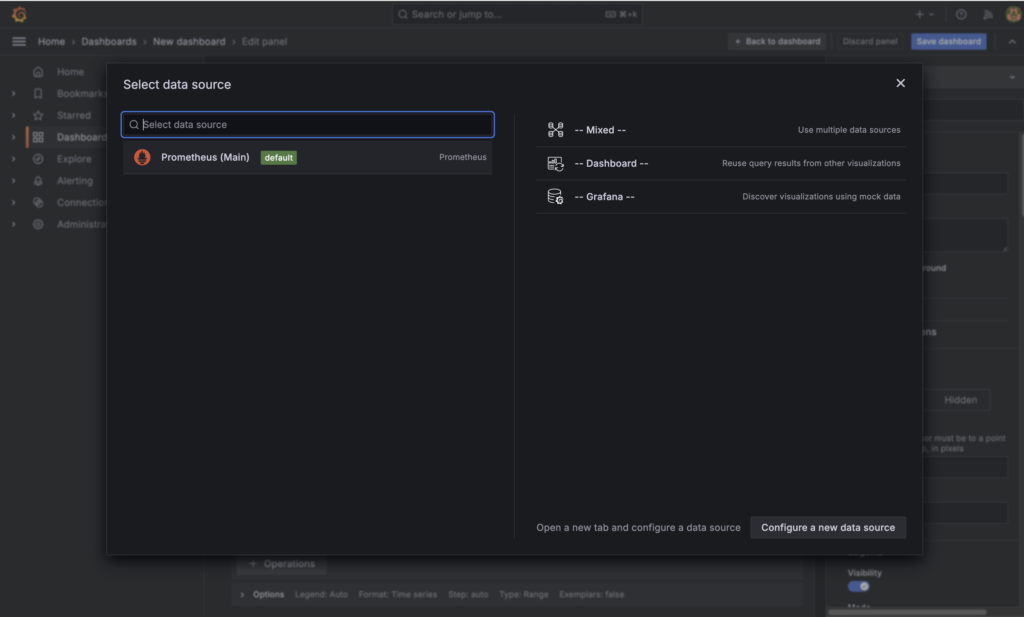
Now that you have your application running, head over to the Grafana dashboard to visualize the metrics you are registering. Open your browser and navigate to `http://localhost:3000`. You will be greeted with the Grafana login page. The login credentials are the ones provided in Compose file.
Once you are logged in, you can create a new dashboard. While creating dashboard you will notice that is default data source is `Prometheus`. This is because you have already configured the data source in the `grafana.yml` file.