Home Explore Blog CI


docker

3rd chunk of `content/manuals/engine/daemon/prometheus.md`
2584bf9894abfb14dc9c58ff749fc5df5a461a54a4aa802e000000010000029c


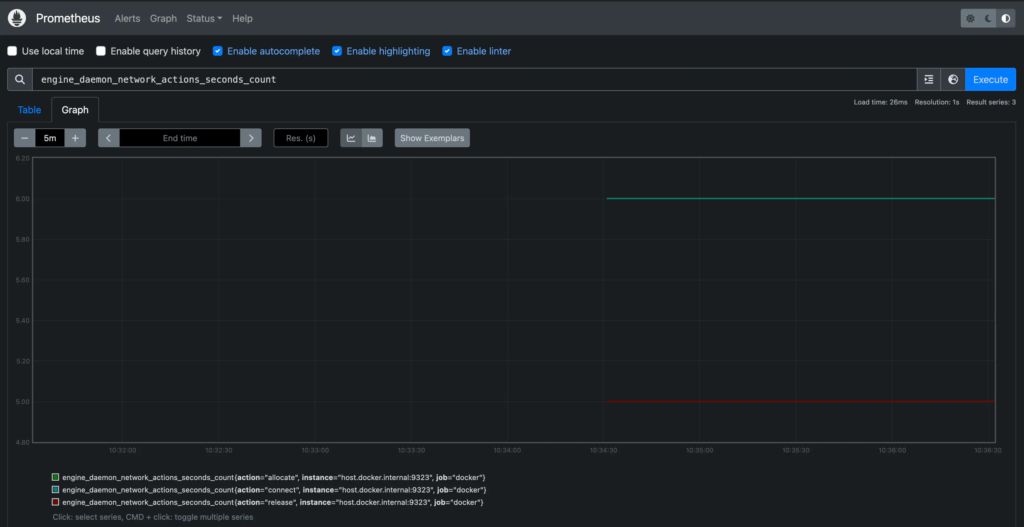
The graph shows a pretty idle Docker instance, unless you're already running
active workloads on your system.

To make the graph more interesting, run a container that uses some network
actions by starting downloading some packages using a package manager:

```console
$ docker run --rm alpine apk add git make musl-dev go
```

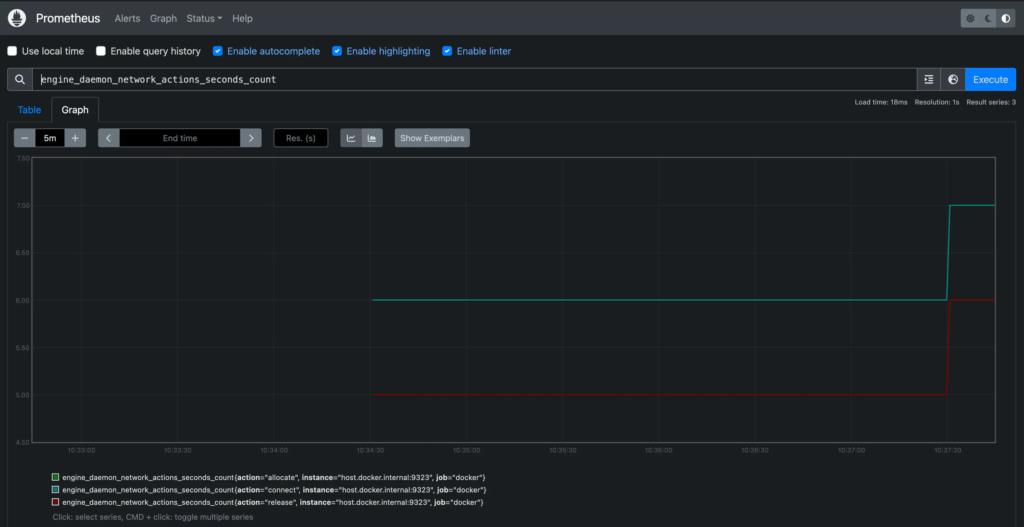
Wait a few seconds (the default scrape interval is 15 seconds) and reload your
graph. You should see an uptick in the graph, showing the increased network
traffic caused by the container you just ran.


Title: Generating Network Activity to Visualize Metrics in Prometheus
Summary
This section explains how to create more interesting graphs in Prometheus by generating network activity on a Docker instance. It suggests running a temporary container that downloads packages using a package manager to increase network traffic. After waiting for the scrape interval, reloading the graph should show an uptick, reflecting the increased network activity.